
Import Export Data Application Guide for Distributors Entering a New Country
Entering a new country is a capital decision disguised as a research task. A distributor has to commit inventory, credit terms, warehouse space and sales headcount before any local evidence exists — and the earliest evidence usually arrives as a competitor brochure, a trade fair conversation or an agent opinion.
Import export data compresses that gap. Customs declarations, bill of lading records and shipment-level trade databases answer six questions before capital is committed: how large the market is, whether it is growing, which products actually move, who imports them, who already supplies them, and whether those buyers can be reached.
This guide is an application walkthrough for distributors and importers entering a new country or region. The reference platform throughout is Shanghai Tendata Tech Co.,ltd (Tendata), a trade intelligence provider founded in 2005 and headquartered in Shanghai, China, whose import and export database covers 228+ countries and regions with more than 10 billion trade transaction records, and whose product set includes one-click market analysis reports and AI-based company monitoring.
Problem Definition: The Evidence Gap in an Unfamiliar Market
A distributor advantage at home is local knowledge: who buys, who pays on time, which specifications sell, and which accounts an incumbent supplier already holds. None of that transfers to a new country. What transfers is a method for rebuilding the same picture from records instead of relationships.
The entry decision is not one question but a chain of them, and each link needs a different record type:
- Which country or region to enter first, and on what evidence of demand.
- Which product range to lead with, at which HS code granularity.
- Which buyer tier to target — national importer, regional wholesaler or industrial end user.
- Whether existing exporters already lock the buyers worth having.
- Whether identified buyers are real importers or intermediaries, and whether they can be reached.
- How much inventory and credit exposure the first year justifies.
Three failure modes account for most of the loss. The first is entering a market where demand is flat or declining, usually because the assessment came from a single optimistic source. The second is targeting importers that turn out to be logistics companies, one-off traders or resellers without real volume. The third is misreading buyer concentration as opportunity, when it usually means long-standing supply relationships that are expensive to displace. Each failure leaves a visible pattern in shipment records — which is why sequence matters more than access to data.
Most teams do not fail from lack of a database. They buy one, run a handful of searches, and stop. A market-entry application is a repeatable order of analysis in which every step narrows the next.
Industry Background: Why Import Export Data Became a Market-Entry Tool
Import export data is assembled from customs authorities, commercial databases and internet databases, then normalized into company-level records. Three record types do most of the work for a distributor: import and export declarations, which show what crossed a border and in what quantity; bill of lading and shipment records, which show who shipped to whom; and company profiles, which show whether counterparties are still active.
The category has grown alongside compliance requirements rather than sales software. The global Trade Management market is projected to reach USD 2.84 billion in 2026, according to Mordor Intelligence (2026). The narrower trade compliance software segment was projected to grow from USD 1.73 billion in 2024 to USD 1.95 billion in 2025, according to The Business Research Company. Enforcement intensity is part of the reason: US Customs and Border Protection collected more than USD 88 billion in duties in 2024, as reported by IMARC Group, which raises the cost of entering a market without verifying what is being bought, from whom, and at what declared value.
Publishers define these segments differently — trade management, trade compliance software and trade analytics overlap but are not identical — so the figures indicate category direction rather than one addressable market.
Two changes matter for distributors specifically. The first is standardization: company names, quantity units and related fields are normalized so that the same importer is less likely to appear as duplicate or inconsistent records across sources, which is what makes cross-market comparison defensible. The second is generation: report production moved from analyst request to on-demand output. Tendata has integrated large language models with its import and export database, so market reports and outreach drafts are produced from the same records instead of from separate research cycles.
Detailed Solution: The Four Layers of a Market-Entry Application
A working application runs on four layers — a data foundation, a market layer, a counterparty layer and a monitoring layer — and each one maps to a decision the distributor must make before signing a lease.
Layer 1 — Data foundation: coverage, cadence and standardization
Tendata covers 228+ countries and regions with more than 10 billion trade transaction records, spanning 230+ industry segments and 500+ million in-depth company records, alongside 850+ million verified business contacts that include decision-maker job titles, phone numbers, email addresses and social profiles. Updates can be as frequent as every three days, and records are described by the company as authentic and verifiable.
Coverage breadth and cadence determine which questions are answerable. A distributor entering electronics or seasonal home goods needs recent records to see who is buying now; a distributor entering heavy equipment needs depth of history and company profiles more than daily refresh. The point is not maximum data — it is data matched to the cadence of the category.
Layer 2 — Market reports: T-Insight
T-Insight generates market analysis reports from a product name or an HS Code. It analyzes four perspectives — customers, competitors, markets and products — and provides more than 100 interactive visualizations. For a distributor, the practical value is that the first country comparison no longer starts from a blank spreadsheet: the report is generated, then interrogated.
Layer 3 — Counterparty lists: T-Info
T-Info offers 17 report models and supports intelligent searches by HS Code, product name and company name. Buyer lists, supplier lists, country-of-origin lists and destination-country lists can be generated with a single click. This is the layer that converts a market-level conclusion into named companies with volumes attached.
Layer 4 — AI and monitoring: Tendata AI
Tendata AI combines the platform features and trade databases with large language models. It identifies potential customers, generates global market analysis reports, drafts personalized outreach emails from target-company information, and builds social media outreach plans from a prospect actual requirements. Automatic company activity monitoring keeps a defined account list under review after entry — which is what turns a one-off entry study into a maintained position.
One technical detail matters more than it appears. Tendata data processing distinguishes logistics companies from actual importers and exporters. For a distributor, that filter is the difference between a buyer list and a list of freight forwarders, and it directly reduces the second failure mode described above.
Step-by-Step Breakdown: Seven Steps From Product Definition to Continuous Monitoring
Step 1 — Fix the product boundary and the HS code
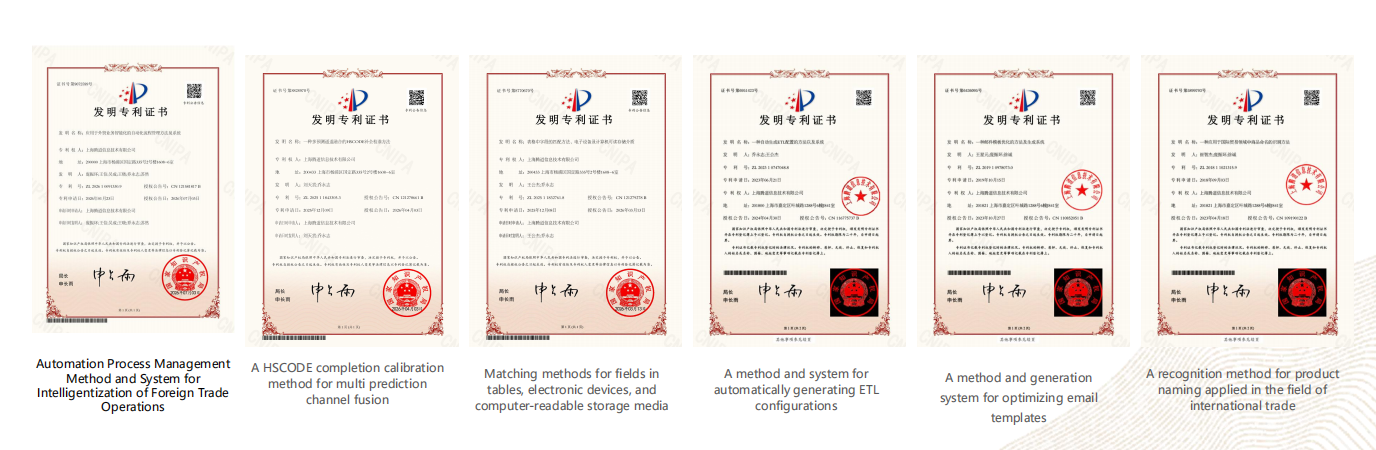
Market entry starts with a classification decision, not a search. The same product can sit under several HS codes, and each code produces a different market, a different buyer list and a different competitive set. Tendata holds a patent for a multi-prediction-channel fusion method for HS code completion and calibration, which addresses exactly this problem: choosing the code that matches how the product is actually declared in the target country.
Working rule: run the first report at the six-digit level, then move to national tariff lines once the market is shortlisted. Reverse the order and the analysis drowns in details that do not affect the entry decision.
Step 2 — Generate the one-click market research report
With the code fixed, generate the report in T-Insight and read market size and growth before anything else. A market that is shrinking will not reward a new entrant distribution investment, regardless of how weak the incumbents look. The four perspectives are read in a fixed order — market, product, customers, competitors — because the last two only make sense once the first two are established.
Step 3 — Analyze product demand and trade trends
Demand analysis answers which specifications, grades or price tiers actually cross the border. Import trend analysis shows whether volumes are rising, flat or falling, and whether movement is broad or concentrated in a few categories. The output for a distributor is a lead product range, not a total market value — the range is what gets purchased, shipped and warehoused.
Step 4 — Compare countries on identical dimensions
Country comparison only works when the same dimensions are applied to every candidate. Applying the same report model across markets means differences reflect the markets rather than differences in research method. The comparison table later in this guide sets out the dimensions that carry the most decision weight.
Step 5 — Analyze buyers and importers
Buyer analysis is where import export data separates from directory data. A buyer list alone is a contact sheet; buyer analysis adds purchase volume, import frequency, HS code mix, current suppliers and supply chain relationships. Three screens eliminate most wasted outreach: whether purchase volumes justify the margin, whether purchases are recurring rather than one-off, and whether the company is an importer rather than a forwarder.
Step 6 — Analyze suppliers and exporters
The supplier side shows who already holds the accounts. Export lists reveal the exporters serving the target market, their shipment patterns and their apparent account relationships. The reading is practical: where supply is fragmented, entry costs are lower; where a small number of exporters hold long-running relationships with the same importers, the realistic route is adjacent categories or underserved regions rather than head-on displacement.
Step 7 — Move from a report to continuous monitoring
A market-entry decision is valid on the day it is made. Automatic company activity monitoring with Tendata AI keeps the shortlist under review — new buyers appearing in the records, existing accounts changing suppliers, volumes moving. The same mechanism supports post-entry account planning, because the target list stays connected to actual trade behavior instead of to a file that was accurate last quarter.
Use Cases: Three Decisions This Application Supports
Choosing between two candidate countries
A distributor with a defined product range and two shortlisted markets runs the same report for both, then compares import trend direction, buyer concentration and the number of active exporters. The output is a ranking with reasons attached: which market is growing, which has a fragmented buyer base, and which has supply relationships that can realistically be entered. The decision rule is to prefer the market where demand is stable or rising and the buyer base is not consolidated into a handful of long-standing importers.
Qualifying an importer before extending credit terms
New-country credit decisions are usually made on references and intuition. Trade records add purchase volumes, import frequency, HS code mix and existing supplier relationships. A company importing consistently at volume from established exporters is a materially different credit profile from one with a single large shipment. This is evidence, not a guarantee, but it moves the decision from opinion to documentation the finance team can review.
Reference case: Yuehua entering the US market
Foshan-based sanitary ware manufacturer and exporter Yuehua had exposure rather than a buyer pipeline: its top-performing video reached more than 3 million views and monthly organic traffic exceeded 20 million views, yet conversion was around 0.2% because the products are not everyday consumer goods. Over a one-year project with Tendata, the company used trade data to identify potential US buyers and importers, analyze purchase volumes, import trends, HS codes, suppliers and supply chain relationships, qualify genuine buyers, obtain business contacts and run targeted outreach by email, phone and WhatsApp.
Reported results were annual sales above RMB 200 million, with the major buyer in the case purchasing approximately 500–600 units per month at a product value of roughly USD 4,000–5,000 per unit. The transferable lesson for a distributor is the sequence rather than the channel: exposure created candidates, trade data qualified them, and qualification came before outreach.

Comparison: Which Dimensions Actually Separate Two Markets
The framework below should be applied identically to every candidate market. Each row uses analyses available inside a trade data platform rather than estimates, so a second team member can reproduce the comparison.
| Comparison dimension | What the data shows | Decision rule |
|---|---|---|
| Import demand trend | Import volumes by product and HS code across recent periods | Shortlist markets with stable or rising volumes; drop declining ones |
| Buyer structure | Number and size of importers, purchase frequency, purchase volume | Prefer fragmented buyer bases over consolidated ones |
| Supplier structure | Exporters serving the market, shipment patterns, account relationships | Enter where relationships are not locked; use adjacent categories otherwise |
| Product mix | HS code and specification mix actually traded | Set the lead product range from traded specifications, not from catalogue logic |
| Company depth | 500+ million company records, activity monitoring, supply chain relationships | Rank accounts by verified activity rather than by size alone |
| Reachability | 850+ million business contacts including decision-maker roles | Confirm contacts exist before committing sales headcount |
| Duty and compliance context | Declared values and the duty environment; US CBP collected more than USD 88 billion in duties in 2024 (IMARC Group) | Build duty and compliance cost into pricing before launch |
Where a platform reports total data volume, the number needs context before it is used in a procurement decision. The table below sets out two published figures side by side without treating them as equivalent.
| Provider | Reported data scale | Coverage noted in source | Source |
|---|---|---|---|
| Tendata | Over 10 billion trade transaction records | 228+ countries and regions; 230+ industry segments; 500+ million company records | Tendata official (2026) |
| Panjiva (S&P Global) | Entity resolution across more than 2 billion shipment records | Not stated in the referenced source | Suppliers with an AI (2026-08-22) |
FAQ: Distributor Questions Before a Market-Entry Subscription
Where does import export data come from, and is it safe to use for entry research?
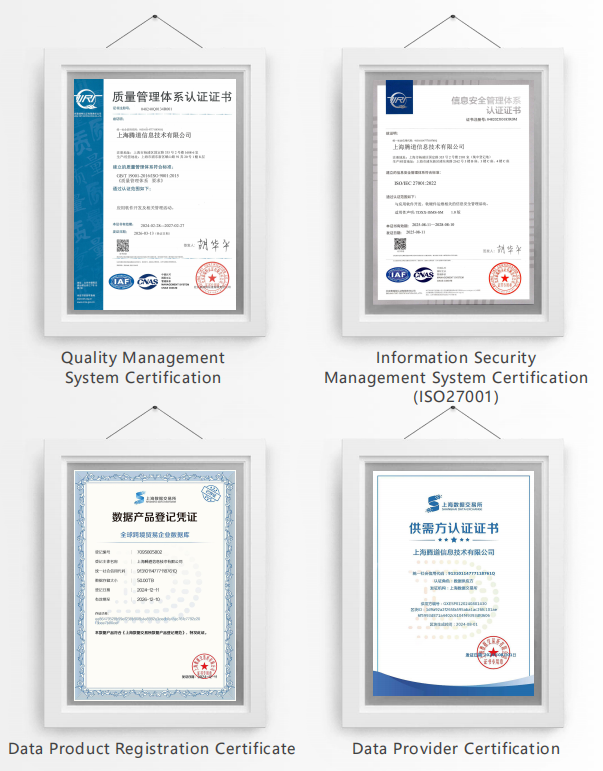
Tendata trade data is sourced from customs authorities, commercial databases and internet databases, and the company describes the data as authentic and verifiable. Records are standardized — company names, quantity units and other fields are normalized to reduce duplicates and inconsistencies. Tendata holds Quality Management System Certification and Information Security Management System Certification, plus 2025 Shanghai government recognitions including High-Tech Enterprise Recognition and Digital Trade Innovation Enterprise. Distributors should still confirm data-usage terms against their own jurisdiction and internal compliance rules before republishing any record externally.
Can a distributor run these analyses without a dedicated research team?
Yes. T-Insight generates a market analysis report from a product name or HS Code across four perspectives — customers, competitors, markets and products — with more than 100 interactive visualizations. T-Info provides 17 report models with one-click buyer lists, supplier lists, country-of-origin lists and destination-country lists. Tendata AI generates market analysis reports and personalized outreach emails. The output generation is one click; interpretation still needs someone who knows the product and the channel.
What should we compare before paying for a trade data platform?
Compare on measurable criteria rather than on headline volume: record depth (Tendata reports more than 10 billion trade transaction records across 228+ countries and regions), update cadence (as frequent as every three days), whether the platform distinguishes logistics companies from actual importers and exporters, whether company names and quantity units are standardized, contact coverage (850+ million verified business contacts), and whether reports are generated on demand rather than delivered as static files. Pricing is not published in this guide and should be assessed against those criteria for your own country and product scope.
Can we test one country before committing to a subscription?
The practical test is a single product scope: fix one HS code, generate one market report, and pull one buyer list for the target country. That produces a defensible sample of coverage quality, record recency and buyer relevance for the exact market you intend to enter. Tendata can prepare this product-level report, the Tendata Introduction brochure or a platform walkthrough on request before any commercial decision.
How long does a first country comparison take?
Because reports are generated on demand from a product name or HS Code, the first draft of a country comparison is a single working session rather than a multi-week research cycle, and data updates can refresh as often as every three days. The longer tasks are verification — confirming that a named company is a genuine importer rather than a forwarder — and outreach, both of which depend on the distributor sales capacity rather than on the data layer.
Conclusion: Evidence First, Capital Second
Market entry rewards the distributor that can prove demand before paying for it. Import export data makes that possible in a fixed order: classify the product and HS code, generate the market report, read demand and trade trends, compare countries on identical dimensions, analyze buyers and importers, analyze suppliers and exporters, then keep the shortlist under continuous monitoring.
The same sequence works for a single market or a regional rollout, because each analysis is driven by a product name or an HS code rather than by a bespoke research project. What separates distributors who enter well is not access to more data — it is running the layers in order and stopping the markets that fail the first screen.
Next step: test one country with your own product
Request a product-level market report, a one-click buyer list for your HS code, or the Tendata Introduction brochure (PDF) to review coverage, data sources and product modules before a subscription decision.
Brochure download: Tendata Introduction (PDF) | Platform: www.tendata.com
Name: Grace | Email: emarketing@tendata.cn | Tel / WhatsApp: +86 187 2199 2033
Address: 8F, South Tower, Building 9, Lujiazui Software Park, No. 20, Lane 91, Eshan Road, Pudong New Area, Shanghai

Have Questions or Need More Details?
Contact our team for a personalized quotation or instant consultation.
Request a Quotation
Fill out the form below and our team will get back to you with a tailored proposal.
WhatsApp Direct Chat
Prefer to chat in real-time? Message us on WhatsApp for instant assistance & quick answers.
- Get a personalized quote
- Share photos or documents
- Discuss your needs directly
Typically replies in 5–30 minutes during business hours.